Municipalities have spent tens of millions of taxpayer money on solar power projects in the last decade as investments and to reduce carbon emissions. However, analysis indicates potentially millions are being lost and tons of additional carbon emitted due to maintenance issues. Shouldn’t municipal candidates in Ontario’s election commit to sharing how taxpayer investments toward carbon reductions are performing? If existing projects are failing what assurances do we have that new projects won’t have similar issues?
How do we know? Boxbrite monitors the performance of hundreds of solar projects every day. We started building our solution over three years ago. At that time we benefited tremendously from the co-operative, SolarShare’s decision to publicly share their data. Their decision allowed us to develop our solution to detect maintenance problems that were being missed by existing solutions. At the same time, we researched and were able to locate other publicly accessible solar projects, including a portfolio of sites for the Region of Waterloo.
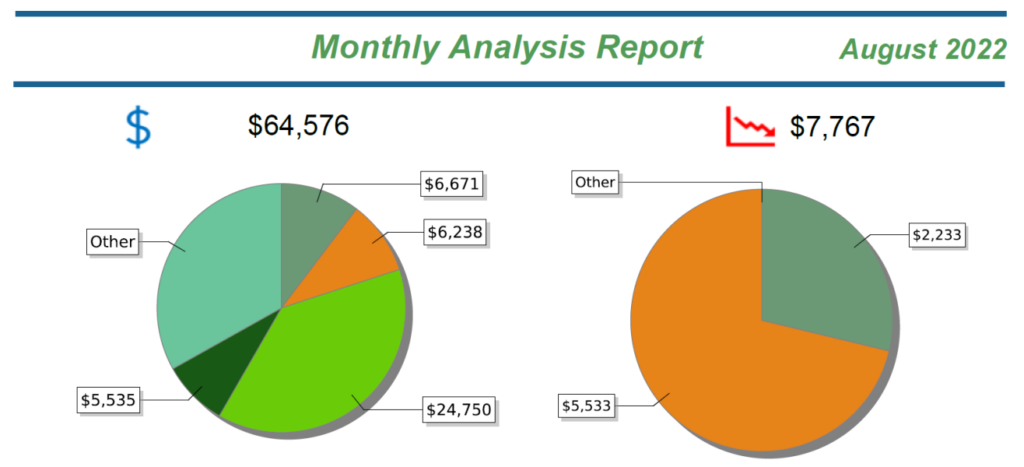
What we’ve learned in the last three years is that hidden losses due to unresolved equipment failures need to be exposed in order to be addressed. Here are two reports for the month of August: SolarShare’s and the Region of Waterloo. Neither organization has validated these specific findings. However, we were introduced to contacts at the Region of Waterloo in May and shared some earlier results, but have not heard back from them since that meeting.
If our performance analysis is correct in August, the ROW portfolio is underperforming by at least 10%. In contrast, the SolarShare portfolio had losses of approximately 0.6% in July and 0.9% in August. In looking at historical data, the ROW Westgate site alone has lost almost $200,000 since the fall of 2019 due to unresolved equipment failure. Public disclosure of performance as SolarShare does should reduce losses with publicly funded solar power systems.
Almost all solar power systems have some form of a public dashboard that is either already active or can be enabled. Here is a link to an article we published in January 2022 about looking up these public portals and hidden losses. We are asking candidates to commit to activating public portals if needed and providing links to those sites. SolarShare and many schools and individual sites already do this. Why can’t our municipal projects as well? We feel that public scrutiny will ensure systems perform as designed and will also provide valuable data for researchers and companies to help develop even better solutions to address climate change.
Using the Linked Reports
The attached monthly reports show the production and losses for each system and include an Executive Summary.
If you click on a system name such as ROW Westgate you will be taken to a live monitor for that system.
You can then on the chart select Y and also revenue and should then see the following chart:

In this chart the year 2016 represents what the system is capable of producing after starting production part way through 2013. All other years have production problems. You can easily see how the losses for this system are approaching $200,000. The same public portal is used by SolarShare. Please note on some systems you will see high yearly values for a single year that are incorrect if you look at the monthly data.