Services
What We Do
Our singular goal is to ensure that your investment in solar energy delivers 100% of its potential over the system’s lifetime. Over the past six years, we have developed the platform, processes, and expertise to support customers across North America. By working with thousands of systems, we have become experts you can rely on. As your trusted auditors, we quickly detect problems in your system(s) that could be costing you money.
Our fixed, transparent, and low-cost pricing for monitoring ensures that we have no incentive to recommend unnecessary repairs—you can trust our advice. If we detect a problem, we will collaborate with your trusted O&M provider or one of our local O&M partners. No matter the situation, you can count on us to look out for your best interests—that’s what you are paying us for.
We offer our services directly to system owners, as well as through our local O&M partners, who provide yearly service plans if you prefer. Either way, our goal remains the same: to help keep your system(s) operating at 100% in the most cost-effective way possible.
Expert Daily Fault Monitoring
Every night, our platform ingests detailed data from thousands of PV systems. We pull from an ever-growing list of platforms, collecting data from inverters, MPPTs, strings, dataloggers, trackers, cameras, and meteorological sources. A single system might have hundreds of inputs. Our carefully developed algorithms then sift through this vast amount of data, focusing on one key metric: whether there is a problem that is costing you money. Our platform doesn’t generate endless error messages for you to investigate—it identifies only the issues that have a financial impact.
That’s where our human experts come in. Years of monitoring have taught us what to look for. We engage you or your designated O&M provider only when we detect a legitimate problem. As your trusted experts, we ensure you spend money addressing real issues—not unnecessary ones. We don’t profit from fixing problems; we make money by detecting them and providing you with the best advice based on our experience.
For example, in this case, our algorithms detected that an MPPT lost a string due to a blown $10 fuse—a common issue that manual monitoring rarely catches. Left unaddressed, this could have cost the customer $1,300 per year in lost production.
Since we don’t profit from selling hardware or additional services, we simply add issues like this to the next scheduled maintenance visit.

Daily Portfolio Monitoring
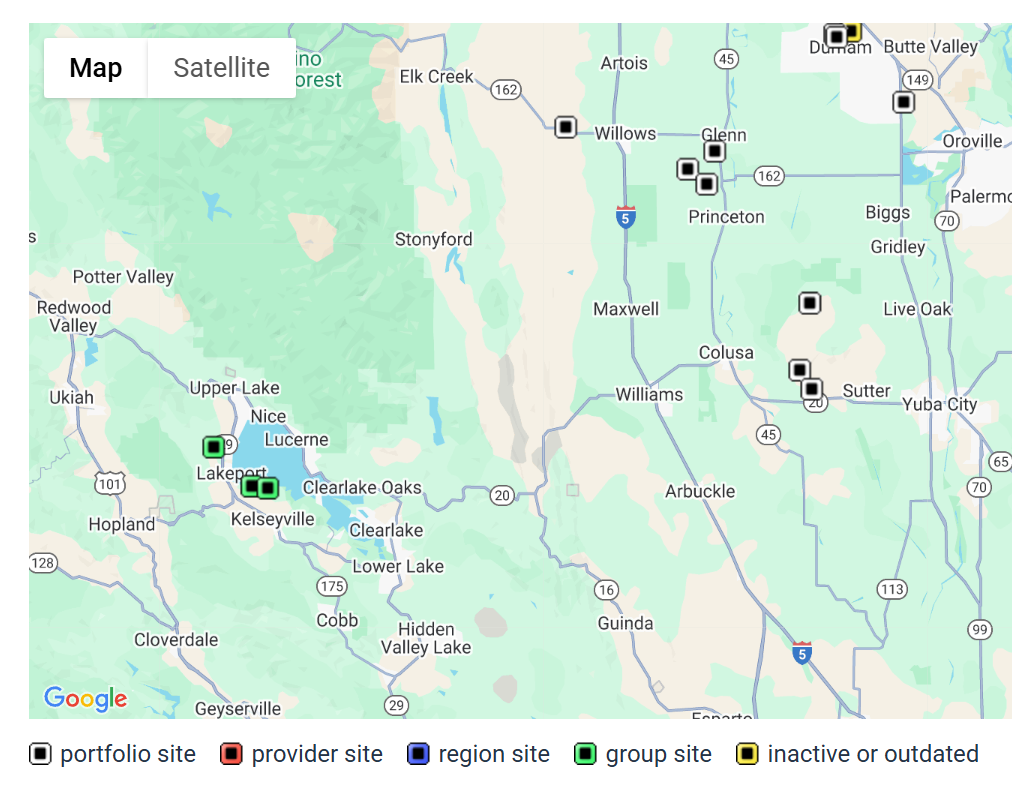
Our overnight fault monitoring can detect issues as subtle as the underperformance of a single string. However, to ensure accuracy, we also compare your system’s total output with other nearby systems we monitor. By analyzing relative output throughout the day, we can quickly identify communication issues or underperformance that fault detection might miss. Our goal is to ensure that no problem goes unnoticed—especially those that could cost you money.
Simple Monthly Reports
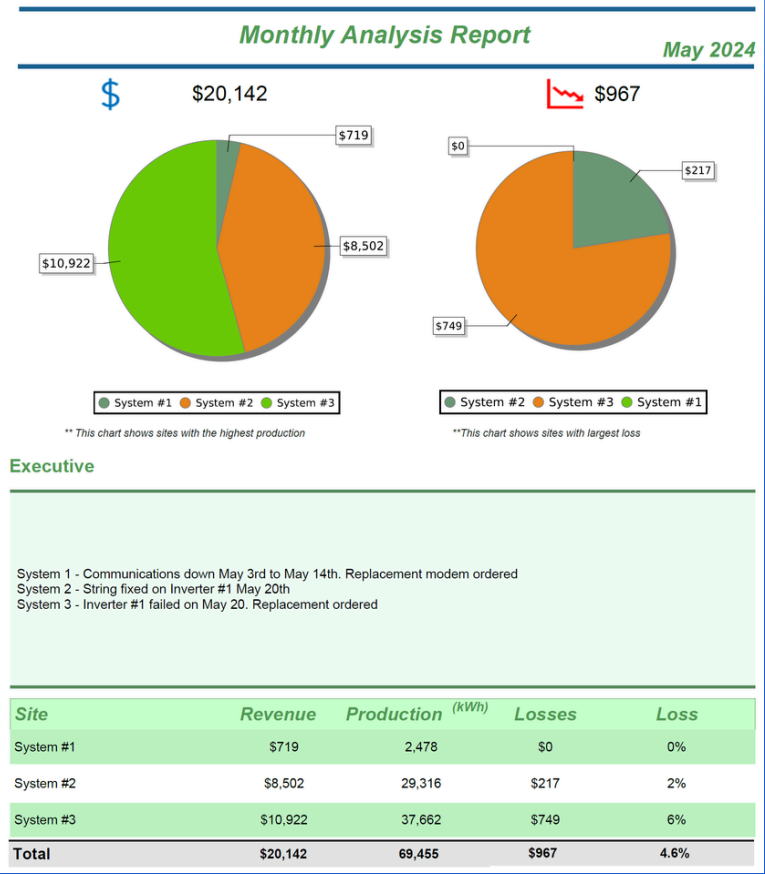
Our goal is to provide you with a simple monthly report that confirms your system(s) is running at 100%. If not, we will tell you what went wrong, how much the issue is costing you, and whether it can be addressed.
We recently worked with a new customer who had a portfolio of systems with a few issues. We told him our goal was to help get his systems to 100% and then deliver “boring” monthly reports that continued to show everything was running smoothly. He responded with, “Boring is good.”
That’s why you can trust us—we are on your side.
These reports serve as assurance that your systems are being carefully monitored. Our algorithms are highly precise, capable of detecting even minor issues, such as self-shading between panel rows during winter months or a tree casting a shadow. We include these details so you know that someone is paying attention.
We also quantify losses in dollar terms so you and your O&M provider can make informed decisions about cost-benefit trade-offs. For example, a customer once asked for advice after their installer offered to send technicians to address ground faults detected in December. Using our platform, we identified the same pattern in previous years and determined that the inverters would naturally clear the issue, resulting in only a few dollars in losses per day during December and January. The customer ultimately chose not to spend thousands on rewiring to fix a minor, temporary issue.
On the other hand, we sometimes advise customers that waiting months for a free inverter replacement under warranty is costing them more in lost production than simply purchasing a new one. If the data supports it, we may suggest investing in hot spare(s) to minimize downtime—not because we profit from selling inverters, but because it’s in the customer’s best interest. That’s why you can trust us, we are on your side.
Free Performance Evaluation
Why Do We Analyze Your System’s Performance for Free?
For a very simple reason—we want to help you keep your system running at 100% for years to come through our monitoring service. We’ve found that the best way to gain new customers is to show them how much additional revenue they could have earned if they had been using our service.
System installers and developers also invest time and effort for “free” to convince customers to choose them for system installation. As one installer told us, purchasing a solar system is often a lifetime decision, and they only have one chance to make their case. Like us, they frequently perform modeling and analysis at no cost to demonstrate the potential returns on your investment.
However, once a system is installed, the financial risk shifts to the owner. If things don’t go well, it’s the owner—not the developer—who loses money. Many of our recent customers had their systems built by Sunworks. They signed contracts and were promised 25 years of worry-free service. Unfortunately, when Sunworks went bankrupt in February 2024, those promises became worthless. Sunworks made its money by building systems, not by monitoring and maintaining them—which ultimately contributed to its bankruptcy.
Our analysis shows that many of their systems had unaddressed issues long before the bankruptcy. These problems went undetected and unresolved for months, even years—costing customers thousands, tens of thousands, or even hundreds of thousands of dollars. How is this possible? Because performing detailed monitoring without a specialized platform like ours requires significant manual effort. And when fixing problems for free cuts into profits, companies like Sunworks were only incentivized to do the bare minimum to continue selling new systems.
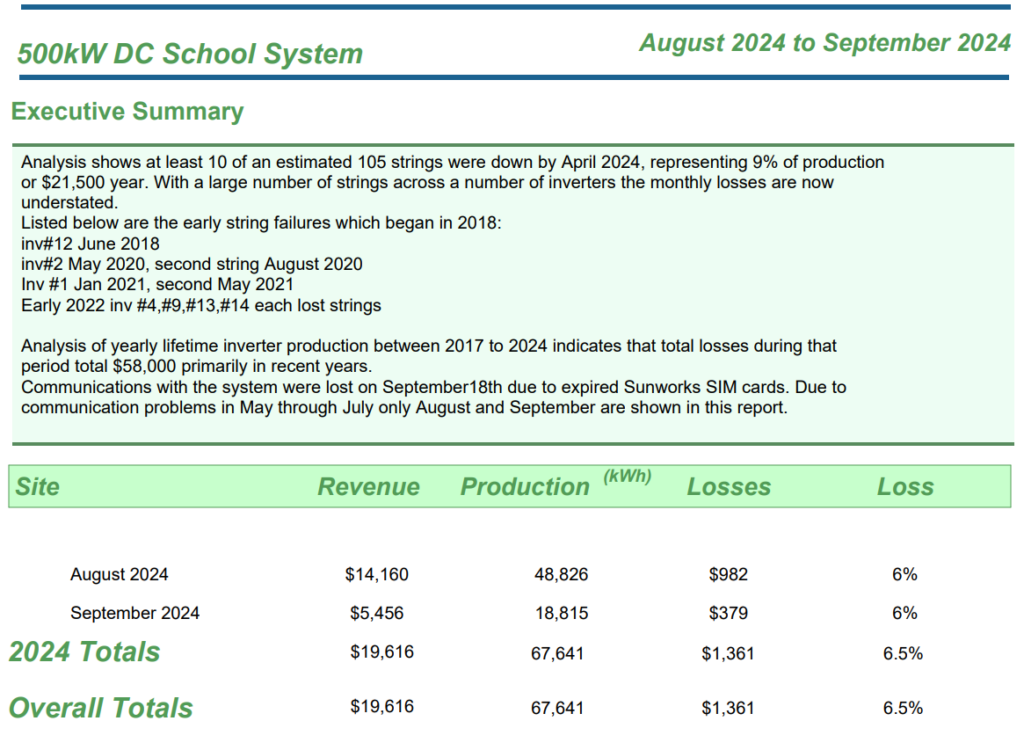
For example, a single string failure on an inverter can lead to $1,300 in annual losses. On most monitoring platforms, this issue is difficult to detect. The report we provide demonstrates the financial impact of such failures over time, using a real case study of a Sunworks 500kW+ system with approximately 105 strings, where 10 strings failed over six years.
How Are We Different?
We don’t rely on one-time sales for profit. Our business model depends on continually proving our value—because you can cancel our service at any time. Unlike Sunworks, we are incentivized to help keep your system operating at 100%. That’s why we offer our performance analysis for free—to show you the financial losses you’ve incurred without our monitoring and to demonstrate that system issues will remain an ongoing risk that needs to be actively managed.
System Performance Consulting
There are times when you need more than just someone to tell you what might have failed since installation—you need someone who can determine why your system isn’t performing at the expected level. We’ve spent years studying systems worldwide, focusing on understanding their performance at a detailed level.
Advanced software like PVSyst or Helioscope can accurately model expected performance in most cases, and even a free online tool like NREL’s PVWatts provides a reasonable production estimate. However, what do you do when your actual production doesn’t match the model and there’s no obvious equipment failure?
This is a challenge we’ve encountered many times over the years. Often, our tools and expertise have identified problems that others have overlooked. We specialize in analyzing data at a highly granular level, sometimes reviewing multiple years of performance. We compare your system to nearby systems and original models, digging into the data to determine why performance isn’t meeting expectations.
One early example from our history involved a customer who had recently added a 250kW AC system to their portfolio, only to find it was underperforming by 10%. They had taken all the right steps during the purchase process, hiring a well-respected engineering firm to produce comprehensive reports spanning several hundred pages, including a PVSyst report on expected performance.
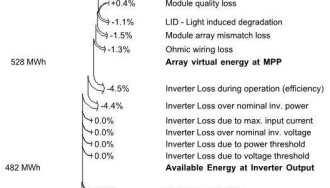
We noticed that the system had a high DC/AC ratio of 174% because the government program only limited AC capacity, not DC, for the 20-year contract. Instead of relying solely on the original modeling estimates for inverter clipping, we compared the system to a nearby installation with a lower DC/AC ratio of 135%. We then modeled how much power loss would occur annually if the DC/AC ratio was increased to 174%. Our analysis revealed that the original model underestimated inverter clipping losses, predicting only 4.4% when in reality, they were at least 15%. This discrepancy represented a $500,000 future revenue loss—an unfortunate reality for the customer, but at least they now understood the cause.
For a more in-depth example of our work, you can download a report we prepared for a customer with a 320kW system that was experiencing both underperformance and equipment failures. In this case, addressing inverter failures required an expensive partial repowering of the system. We worked closely with the customer and their O&M provider to evaluate different options, conducting a cost-benefit analysis of various scenarios. Ultimately, they opted for a partial repowering approach, which also freed up hot spares to replace failing older inverters.
Since implementing these changes, the system has exceeded its previous performance and now operates at 100%—except for brief periods when an older inverter fails and is swapped with a hot spare. We continue to provide daily monitoring and monthly reports on the performance of both the repowered system and a new system they’ve recently constructed.