Ontario was an early global leader in PV installations due to the government’s FIT and MicroFIT programs, which began in 2009. The FIT program guaranteed long-term, 20-year contracts for solar energy producers with fixed, above-market rates for electricity fed into the grid. This initiative attracted significant investment and drove rapid growth in the PV sector.
However, there is little published data on the long-term performance of these systems, which would be valuable as more systems continue to be deployed. This report provides a comprehensive analysis of 142 PV system performance across Ontario, with a particular focus on the impact of operation and maintenance (O&M) practices. By benchmarking these systems, we aim to identify best practices and areas for improvement, ultimately contributing to the optimization of PV performance and the achievement of Ontario’s clean energy goals.
Methodology
This report’s methodology involved collecting and analyzing data from public portals for various PV systems installed by schools, government entities, and cooperatives.
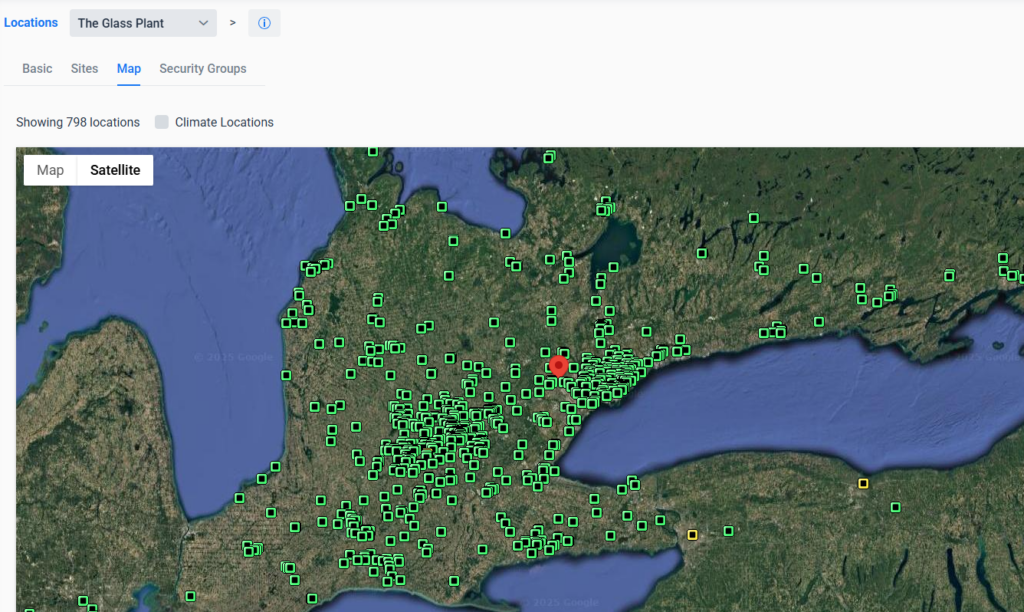
Data was extracted from 142 systems, totaling nearly 24MW DC with 699 inverters, using publicly accessible portals. This dataset is significantly larger than the 1.5MW of data currently available from PVOutput for all of Canada, which primarily includes residential systems.
The vast majority of these systems utilize the SolarVu portal and can be accessed via either the Big Green Board or SolarShare portfolio view. Only active systems were included in this analysis. Many larger systems on the Big Green Board appear to have transitioned to different owners and monitoring platforms, with data unavailable for several years; these were therefore excluded.
Although multiyear data was examined, the benchmarking reports focus on data from May 2024. This month was chosen as it represents a period when systems should be fully operational for peak summer production, with snow-related underperformance and moisture-related faults no longer present. Additionally, soiling and shadowing are less of a factor during this time.
The collected data was processed using the Boxbrite Workbench platform, which normalizes expected output based on DC sizing at the MPPT or inverter level and facilitates the generation of monthly performance reports. Boxbrite has been collecting data from these and customer systems for several years, and the same monthly reporting processes used for customers were applied in this analysis.
Revenue and losses were calculated based on listed kWh revenue rates for each system.
The Workbench platform estimates losses by examining relative performance between components within systems that have multiple inverters or MPPTs. MPPT-level data extraction was not possible from the CacheLAN portal, impacting the automatic calculation of losses from a single string. However, comparing relative kWh/DC kW values from nearby systems proved effective in identifying underperformance and estimating financial losses, which are included in the commentary for each report.
Monthly reports were automatically generated, each including commentary on portfolio performance for the given month. These reports also highlight persistent issues, financial impacts, and significant changes since May 2024.
Systems were grouped into portfolios based on the identified organizations responsible for them. In many cases, school districts were used as the primary grouping, with further subdivisions into public and Catholic boards when necessary. The assumption was that each portfolio likely had distinct monitoring and O&M practices. This grouping also ensured that systems within each portfolio were geographically close and received similar sunlight. The exception was SolarShare, which has a province-wide portfolio that includes a mix of ground-mount, single-axis, dual-axis trackers, and rooftop installations, making direct comparisons more complex.
Key Findings
The following key findings emerged from this analysis:
- O&M practices significantly impact PV system performance. Losses due to failed components in May 2024 varied widely, from 0% to levels exceeding 20%. These findings align with Boxbrite’s analysis of over 1,200 systems over the years.
- The reasons for performance variation differ by portfolio. Some portfolios exhibit patterns of communication failures or inverter breakdowns that are never addressed, suggesting a lack of ongoing O&M considerations. In other cases, problems develop but take months or years to resolve, leading to unnecessary financial losses. For example, a 10kW MicroFIT system can generate approximately $1,000 per month in revenue, which cannot be recovered if repairs are delayed.
- Assigning a dollar value to long-term losses clarifies that effective monitoring and O&M more than pay for themselves. For example, analysis of Bishop Allen Academy’s system indicates losses totaling $100,000 since 2020, with the system currently non-operational.
- Even with dedicated monitoring and O&M resources, performance degradation can occur over time. In 2022, analysis showed that SolarShare experienced losses around 1%. However, due to higher failure rates of older, orphaned inverters on some sites, this figure increased to 2.7% in May 2024 despite their best efforts. This highlights the challenges associated with aging systems and long-term maintenance.
Recommendations
Based on these findings, the following recommendations are proposed:
- Although all benchmarked systems have public portals, only SolarShare provides direct access to them on its website. This transparency fosters accountability and improved outcomes. To raise funds through Solar Bonds, SolarShare must prepare an Offering Statement detailing historical and projected performance—an approach not adopted by other public portfolios.
- Other portfolios occasionally report expected performance or production figures. For instance, York Catholic School District’s 2024-2029 plan states that its 115kW AC systems produced 59MW in 2023. However, this output is nearly half of the expected amount. Many organizations highlight their PV investments along with projected revenue and greenhouse gas reductions, yet few make their monitoring portals publicly accessible. Notably, a 2022 article on underperformance in the Region of Waterloo led to parts being ordered and system improvements, demonstrating the impact of public scrutiny.
- Achieving the expected ROI from PV systems over 20+ years requires careful planning and execution. Equipment failures will occur and must be anticipated with appropriate replacement plans and budgets. A 40-year-old system in Switzerland continues to operate at 80% efficiency—better than many of the benchmarked systems—because its inverters have been replaced five times. Simply discarding failing inverters or panels is not a sustainable solution, as outlined in a related article.
Conclusion
This benchmarking report highlights a significant issue with O&M practices for PV systems in Ontario. High-performing systems and portfolios remain the exception rather than the norm.
Given the widespread underperformance linked to inadequate O&M, Ontario must develop the necessary people, processes, and technologies to address this challenge. If we led the world in PV installations 15 years ago, shouldn’t we now lead in keeping these systems operating efficiently? Further benchmarking and greater transparency are essential to achieving this goal.
Transitioning to a clean energy future requires innovative solutions and collective effort. Ignoring these issues will not lead to progress. Instead, proactive measures must be taken to ensure long-term success in Ontario’s renewable energy sector.
Appendix A: Individual Portfolio Results
This section summarizes the results for each portfolio, grouping systems based on logical criteria. Not all systems for an organization may be listed for various reasons. Likewise, not all systems within a portfolio necessarily share the same O&M provider. Best efforts were made to determine logical portfolio groupings and to gather details such as DC sizing and exact locations. However, errors may still be present, which could impact the results. Additionally, inaccuracies in either the monitoring data or our analysis may exist, so readers should conduct their own independent research and not rely solely on this data as fully accurate.
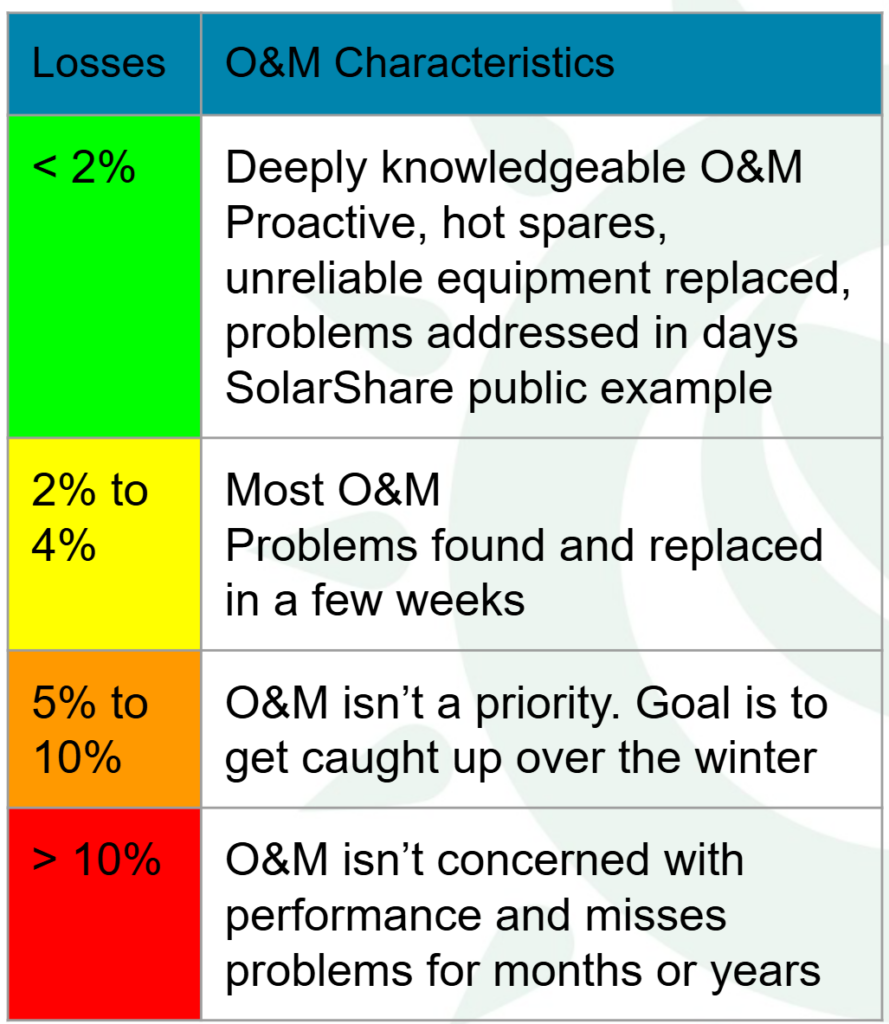
A few years ago, we developed a color-coded ranking system for O&M performance, based on our experience, to assist in evaluating portfolios. Well-constructed PV systems typically have a low individual failure rate, but issues inevitably arise over time. In many cases, systems may operate without problems for three to five years. However, some systems experience failures within months, often due to wiring and construction issues. Over time, even the best-constructed systems will develop problems as wiring and components degrade.
One of the most common issues arises because inverters are designed to detect small leakage currents from ground or arc faults, which can cause them to shut down or fail to start if such currents are detected. When moisture is present from dew, rain, or snow, inverters may not produce power. Some faults clear naturally, while others require an onsite visit. These faults tend to appear quickly in poorly constructed systems but can also develop in well-built systems as wiring ages and leakage currents increase.
Diagnosing and addressing these problems after construction can be time-consuming. Often, service personnel, after encountering repeated faults, will disconnect a string to allow the inverter to power up. While temporarily disconnecting a string due to time constraints may be a reasonable short-term solution—such as the instance noted in the SolarShare report for Orenda, Brampton—it can lead to long-term losses if the string is left permanently disconnected. Each disconnected string can result in an annual revenue loss of $1,000 to $2,000. Additionally, string fuses may blow for various reasons and remain unreplaced.
We monitor portfolios of similar size that consistently maintain 0% losses in most months. However, in some cases, keeping losses below 2% may not be cost-effective. An example would be ground faults in winter months. In contrast, some new customers were experiencing losses exceeding 10%, with some as high as 50%, before we identified and reported their losses.
Depending on the portfolio, it may not always be necessary to invest in hot spares for inverters if the revenue losses from waiting for an RMA (Return Merchandise Authorization) are acceptable. However, portfolios that consistently show “orange” or “red” performance would significantly improve their financial outcomes by implementing better O&M processes to reduce ongoing revenue losses.
The table below lists the portfolios, the number of systems and inverters, and the total DC size. The portfolios are color-coded based on their May 2024 results. Reports for each portfolio can be accessed by clicking on the portfolio name, and within each report, clicking on an individual site name will direct you to the site’s public portal.
| Name | Total DC kW | # of Systems | # of Inverters |
| 2,217 | 7 | 109 | |
| 2,044 | 6 | 24 | |
| 812 | 18 | 27 | |
| 614 | 4 | 17 | |
| 1,354 | 16 | 53 | |
| 14,589 | 51 | 403 | |
| 30 | 3 | 3 | |
| 784 | 6 | 6 | |
| 818 | 6 | 15 | |
| 166 | 7 | 17 | |
| 81 | 8 | 8 | |
| 383 | 10 | 17 | |
| Total | 23,891 | 142 | 699 |
Appendix B: Detailed Analysis of York District Schools
Many of the monthly reports referenced above include commentary on issues beyond May 2024. Investigating these issues involves analyzing CacheLAN data and conducting examinations within the Workbench application.
For the York District Schools, we have prepared a more detailed report that highlights the process of identifying and diagnosing historical issues. This report illustrates how problems are investigated and conclusions are reached based on available data.
While preparing similar reports for every portfolio would be too time-consuming, this example provides insight into the methodologies used to investigate failures and measure their impact. The report is representative of the historical performance analyses we conduct for potential customers.
Appendix C: Overview of the CacheLAN Public Portal
Most of the analysis and reports in this study were generated using our internal Workbench platform. Our system is capable of ingesting data from a variety of sources, including CacheLAN’s public portal. However, we still rely on external platforms like CacheLAN to validate issues we encounter, as they provide access to additional data.
For example, while we cannot currently ingest MPPT-level data and certain other parameters directly from CacheLAN, this information remains available in their portal. Given that nearly all the systems in this report—except those operated by Synergy North—use CacheLAN, we have included brief instructions to help users examine individual system performance.
The examples in this section refer to SolarShare’s Panjetan system in Markham. The screenshots were taken on February 12, 2025, during a period of heavy snow accumulation. As a result, several inverters were faulting, which is not uncommon in Ontario during the winter months.
The Site tab provides high-level information about the system, including a description and, if available, a real-time camera display.

The LIVE tab provides both real-time and historical data. Selecting the Y option displays performance data since the system’s installation.
For systems equipped with the Paycheck option—a Revenue Grade Meter (RGM)—this data is used, as it is more reliable. For systems without Paycheck, data is sourced from individual inverter reports.
If inverters fail to report data for extended periods, you may observe unusual patterns, such as extremely low performance for a given year or month, followed by unusually high performance. Similarly, replacing an inverter can cause sudden spikes in reported performance. This occurs because the measurements rely on lifetime meter readings from the inverters, which can change significantly when an inverter is replaced.

Assuming the system owner has renewed their Surepoint contract additional information about inverter issues is then available via the ANALYZER tab.

There are many options and pieces of information available, and the data presented depends on the type of inverters installed in the system. In this particular system, there are seven inverters—six Fronius units and one AE3TL.
At the time these screenshots were taken, three inverters were producing power, two had insulation faults, and the AE3TL inverter was displaying an arc fault (as shown below). Insulation faults typically resolve on their own as the wiring dries out, but arc faults often require a manual restart of the inverter.
The Last Data Updated and Last Communication timestamps are also useful for determining when an inverter last transmitted data and when the most recent update was received.
